之前看了mjj用的MyNodeQuery三网延迟监控感觉很酷!但是MyNodeQuery目前未开源,就打算直接给哪吒面板扩展下,所有有了下面的DIY
后端变动
Task执行节点
在原始逻辑里,选执行Task的节点有两种策略:
- 覆盖所有,仅特定节点不请求
- 忽略所有,仅通过特定节点请求
但上面两种策略,都只会选择出一个节点执行Task,具体可以看下代码,Send一次之后直接break
func DispatchTask(serviceSentinelDispatchBus <-chan model.Monitor) {
	workedServerIndex := 0
	for task := range serviceSentinelDispatchBus {
		round := 0
		endIndex := workedServerIndex
		singleton.SortedServerLock.RLock()
		// 如果已经轮了一整圈又轮到自己,没有合适机器去请求,跳出循环
		for round < 1 || workedServerIndex < endIndex {
			// 如果到了圈尾,再回到圈头,圈数加一,游标重置
			if workedServerIndex >= len(singleton.SortedServerList) {
				workedServerIndex = 0
				round++
				continue
			}
			// 如果服务器不在线,跳过这个服务器
			if singleton.SortedServerList[workedServerIndex].TaskStream == nil {
				workedServerIndex++
				continue
			}
			// 如果此任务不可使用此服务器请求,跳过这个服务器(有些 IPv6 only 开了 NAT64 的机器请求 IPv4 总会出问题)
			if (task.Cover == model.MonitorCoverAll && task.SkipServers[singleton.SortedServerList[workedServerIndex].ID]) ||
				(task.Cover == model.MonitorCoverIgnoreAll && !task.SkipServers[singleton.SortedServerList[workedServerIndex].ID]) {
				workedServerIndex++
				continue
			}
			// 找到合适机器执行任务,跳出循环
			singleton.SortedServerList[workedServerIndex].TaskStream.Send(task.PB())
			workedServerIndex++
			break
		}
		singleton.SortedServerLock.RUnlock()
	}
}
但在我们的场景中,预期是我选择多个节点,然后所有节点都会去Ping(除了特定节点),因此Send一次之后不能直接break需要继续查找节点。
{
// ..........
        if (task.Cover == model.MonitorCoverAll && task.SkipServers[singleton.SortedServerList[workedServerIndex].ID]) ||
        (task.Cover == model.MonitorCoverIgnoreAll && !task.SkipServers[singleton.SortedServerList[workedServerIndex].ID]) {
        workedServerIndex++
        continue
      }
      if task.Cover == model.MonitorCoverIgnoreAll && task.SkipServers[singleton.SortedServerList[workedServerIndex].ID] {
        singleton.SortedServerList[workedServerIndex].TaskStream.Send(task.PB(singleton.SortedServerList[workedServerIndex].ID))
        workedServerIndex++
        continue
      }
      if task.Cover == model.MonitorCoverAll && !task.SkipServers[singleton.SortedServerList[workedServerIndex].ID] {
        singleton.SortedServerList[workedServerIndex].TaskStream.Send(task.PB(singleton.SortedServerList[workedServerIndex].ID))
        workedServerIndex++
        continue
      }
      // 找到合适机器执行任务,跳出循环
      // singleton.SortedServerList[workedServerIndex].TaskStream.Send(task.PB())
      // workedServerIndex++
      // break
}
Task proto调整
当前执行Task的数据结构中,只存在MonitorId、MonitorType,仅通过这两个信息无法确定到底这个avg_delay具体时延是哪个节点Ping之后的结果。
- Before
message Task {
	uint64 id = 1;
	uint64 type = 2;
	string data = 3;
}

message TaskResult {
	uint64 id = 1;
	uint64 type = 2;
	float delay = 3;
	string data = 4;
	bool successful = 5;
}
- After
message Task {
+++ uint64 server_id = 4;
}

message TaskResult {
+++ uint64 server_id = 4;
}
新增了ServerID字段,因此通过ServerID+MonitorID便可以确定一个TCPPing是谁Ping的谁。
Dashboard调整
在Dashboard中,需要接受Agent发送的请求,并进行处理,因此需要在接受请求的部分需要调整,需要将MonitorID+ServerID+AvgDelay存储下来
...
if mh.Type == model.TaskTypeTCPPing {
	monitorTcpMap, ok := ss.serviceResponseTCPPing[mh.GetId()]
	if !ok {
		monitorTcpMap = make(map[uint64]*tcppingStore)
		ss.serviceResponseTCPPing[mh.GetId()] = monitorTcpMap
	}
	ts, ok := monitorTcpMap[mh.GetServerId()]
	if !ok {
		ts = &tcppingStore{}
	}
	ts.count++
	ts.ping = (ts.ping*float32(ts.count-1) + mh.Delay) / float32(ts.count)
	if ts.count == _CurrentTCPPingStatus {
		ts.count = 0
		if ts.ping > float32(Conf.MaxTCPPingValue) {
			ts.ping = float32(Conf.MaxTCPPingValue)
		}
		if err := DB.Create(&model.MonitorHistory{
			MonitorID: mh.GetId(),
			AvgDelay:  ts.ping,
			Data:      mh.Data,
			ServerID:  mh.GetServerId(),
		}).Error; err != nil {
			log.Println("NEZHA>> 服务监控数据持久化失败:", err)
		}
	}
	monitorTcpMap[mh.GetServerId()] = ts
	if !(rand.Intn(len(ServerList)) == 0) {
		continue
	}
}
...
Api新增
前端需要使用到Ajax动态更新流量图,因此需要提供一个Api查询NetworkMonitor,再展示出来
前端
前端使用vue+echart+jQuery
-
新增页面
Network页面
页面首先是直接把service.html文件复制一遍,然后改改名字,就可以看到下面这样式

-
网络监控页面新增
TCPPing图
在画图上使用的eChart,eChart使用起来不算复杂,可以看看官方文档,这里我选了一个实用性看起来最高的图,x轴可以拖动时间尺度,核心代码如下,示例参考如下https://echarts.apache.org/examples/zh/editor.html?c=area-time-axis
let base = +new Date(1988, 9, 3);
let oneDay = 24 * 3600 * 1000;
let data = [[base, Math.random() * 300]];
for (let i = 1; i < 20000; i++) {
  let now = new Date((base += oneDay));
  data.push([+now, Math.round((Math.random() - 0.5) * 20 + data[i - 1][1])]);
}
option = {
  tooltip: {
    trigger: 'axis',
    position: function (pt) {
      return [pt[0], '10%'];
    }
  },
  title: {
    left: 'center',
    text: 'Large Ara Chart'
  },
  toolbox: {
    feature: {
      dataZoom: {
        yAxisIndex: 'none'
      },
      restore: {},
      saveAsImage: {}
    }
  },
  xAxis: {
    type: 'time',
    boundaryGap: false
  },
  yAxis: {
    type: 'value',
    boundaryGap: [0, '100%']
  },
  dataZoom: [
    {
      type: 'inside',
      start: 0,
      end: 20
    },
    {
      start: 0,
      end: 20
    }
  ],
  series: [
    {
      name: 'Fake Data',
      type: 'line',
      smooth: true,
      symbol: 'none',
      areaStyle: {},
      data: data
    }
  ]
};
除了基础的html变化,接下来就是需要处理后端传回来的数据,需要将数据处理成option中的格式,具体如下
redirectNetwork(id) {
	this.getMonitorHistory(id)
	.then(function(monitorInfo) {
		  var vm = network.__vue__;
		  vm.parseMonitorInfo(monitorInfo);
	})
	.catch(function(error){
		window.location.href = "/404";
	})
},
getMonitorHistory(id) {
	  return $.ajax({
		url: "/api/v1/monitor/"+id,
		method: "GET"
	  });
},
parseMonitorInfo(monitorInfo) {
	console.log(monitorInfo);
	let tSeries = [];
	let tLegendData = [];
	for (let i = 0; i < monitorInfo.result.length; i++) {
		let data = [];
		for (let j = 0; j < monitorInfo.result[i].created_at.length; j++) {
			data.push([monitorInfo.result[i].created_at[j],monitorInfo.result[i].avg_delay[j]]);
		}
		tLegendData.push(monitorInfo.result[i].monitor_name);
		tSeries.push({
				name: monitorInfo.result[i].monitor_name,
				type: 'line',
				smooth: true,
				symbol: 'none',
				data: data
		});
	}
	this.option.title.text = monitorInfo.result[0].server_name;
	this.option.series = tSeries;
	this.option.legend.data = tLegendData;
	const hour = new Date(Date.now()).getHours()
	if (hour > 17 || hour < 4) {
		this.option.legend.textStyle.color = "#F1F1F2";
		this.option.title.textStyle.color = "#ccc";
	}
	myChart.setOption(this.option);
}
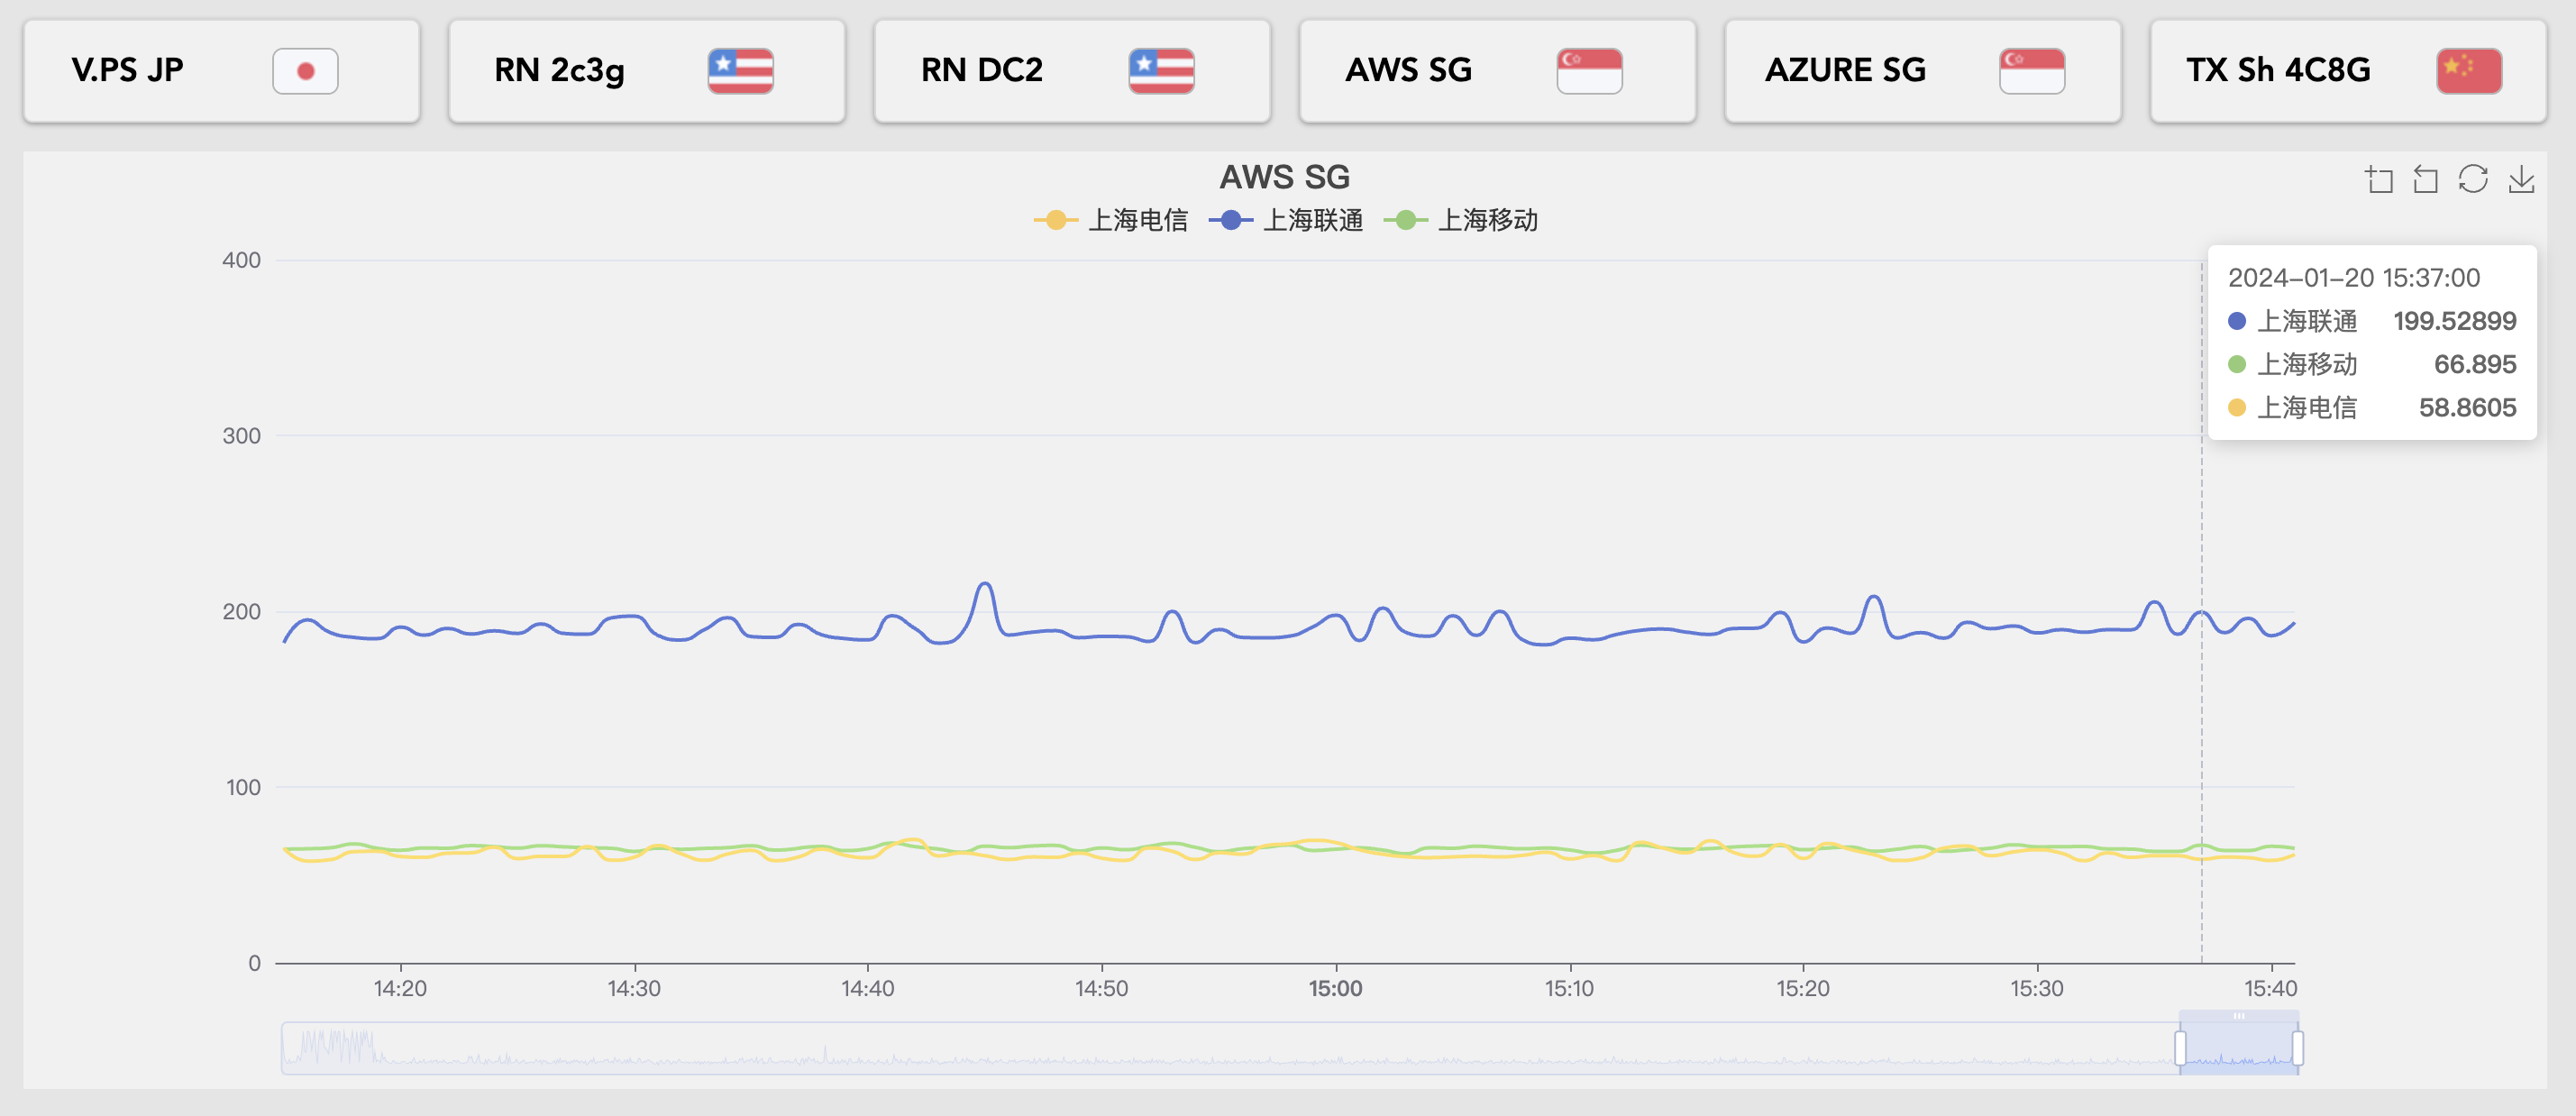
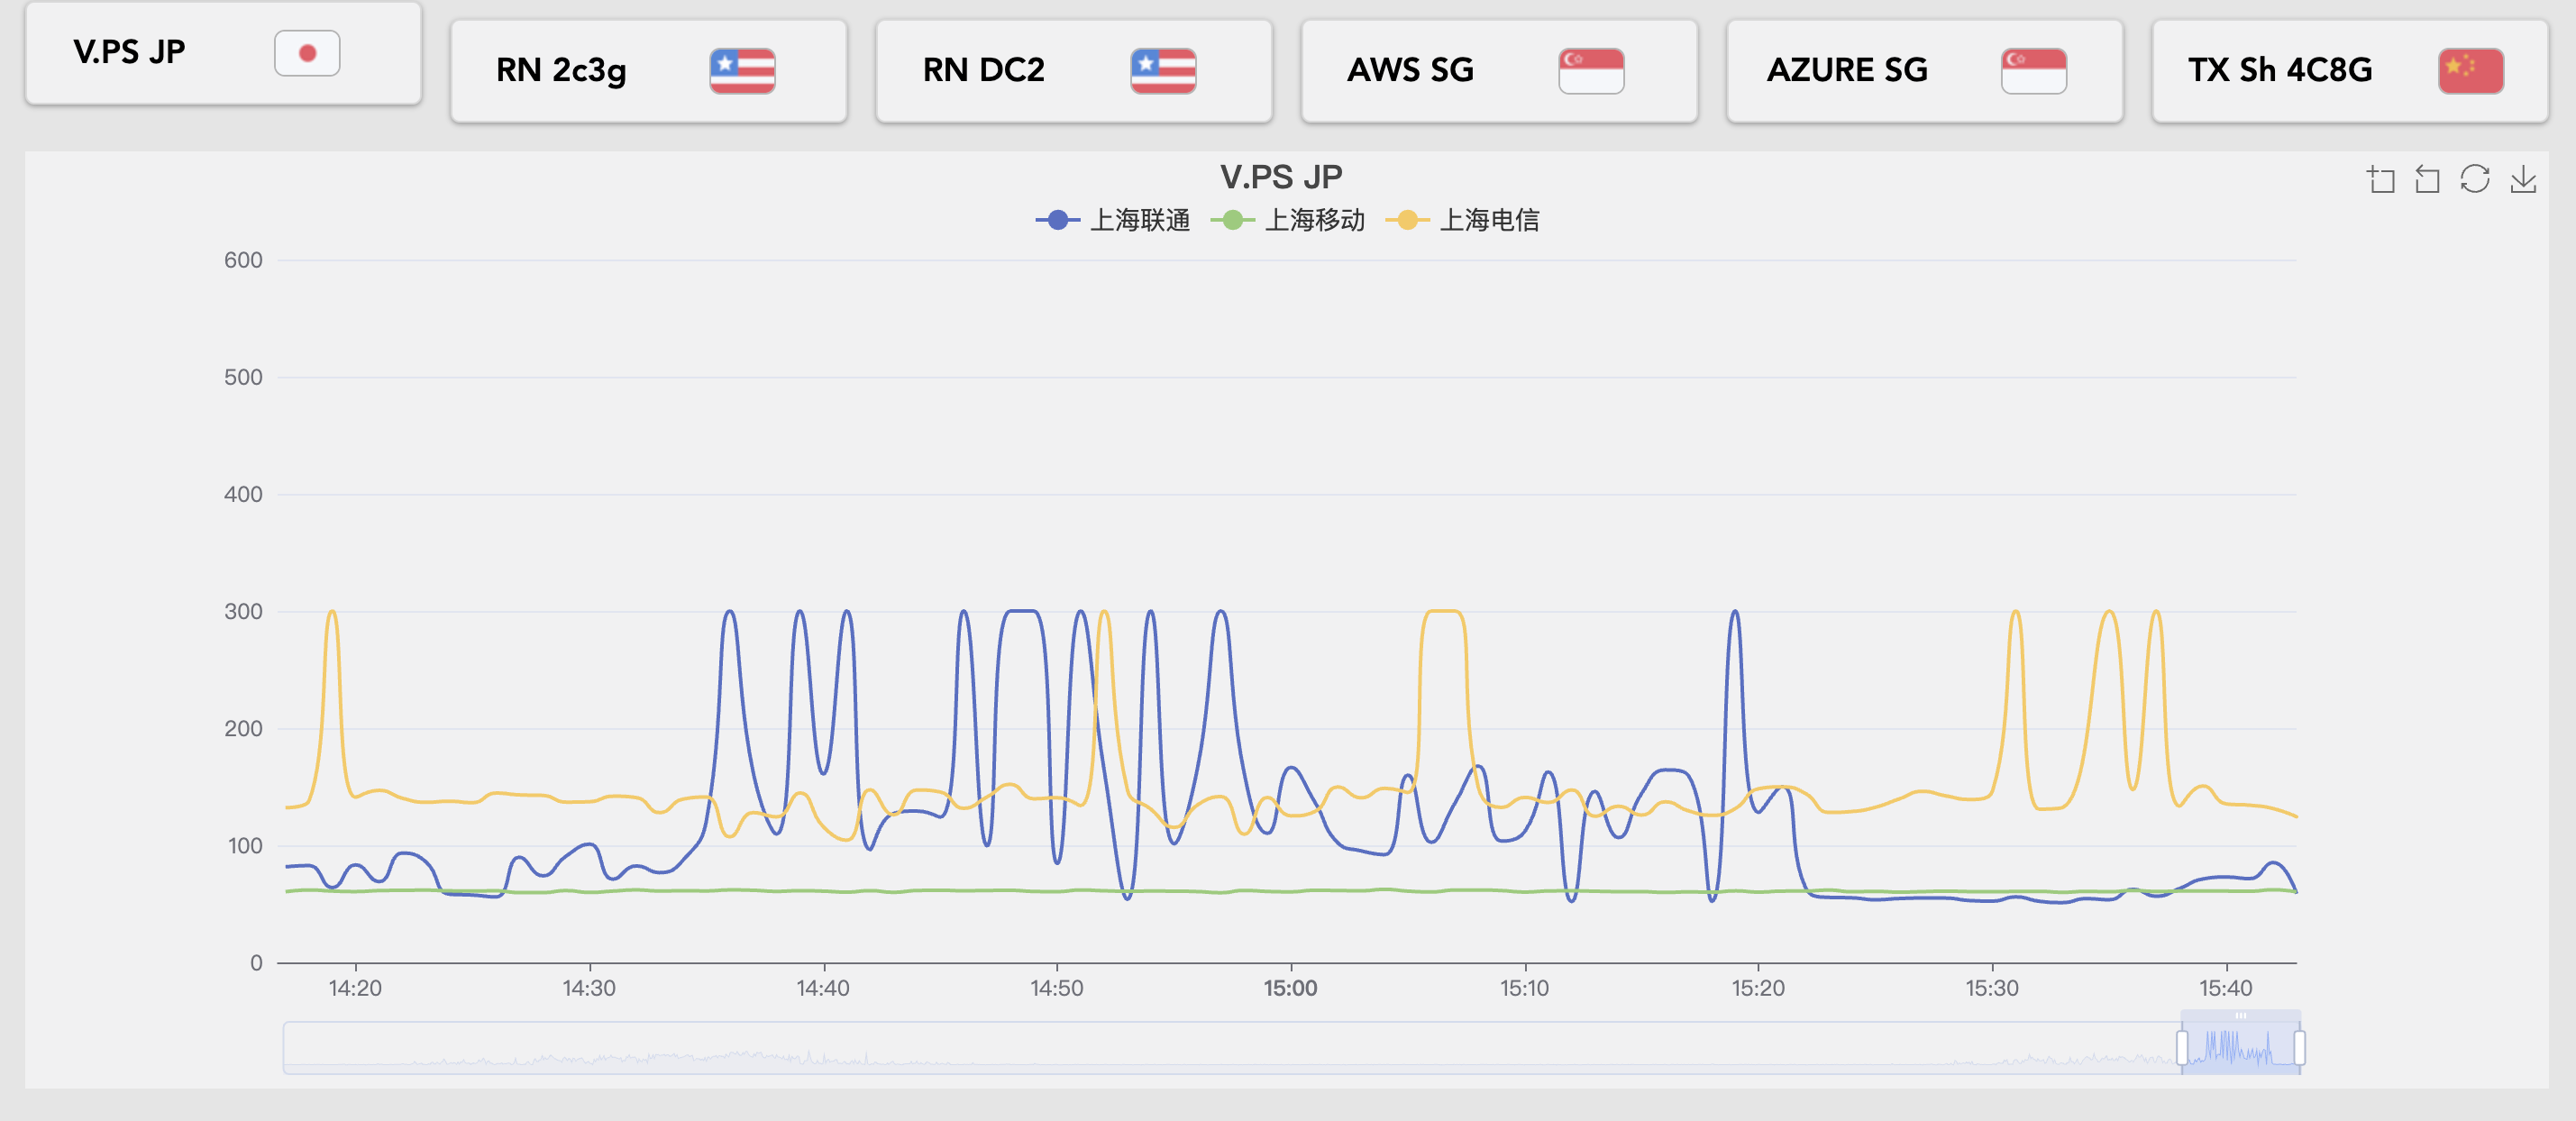
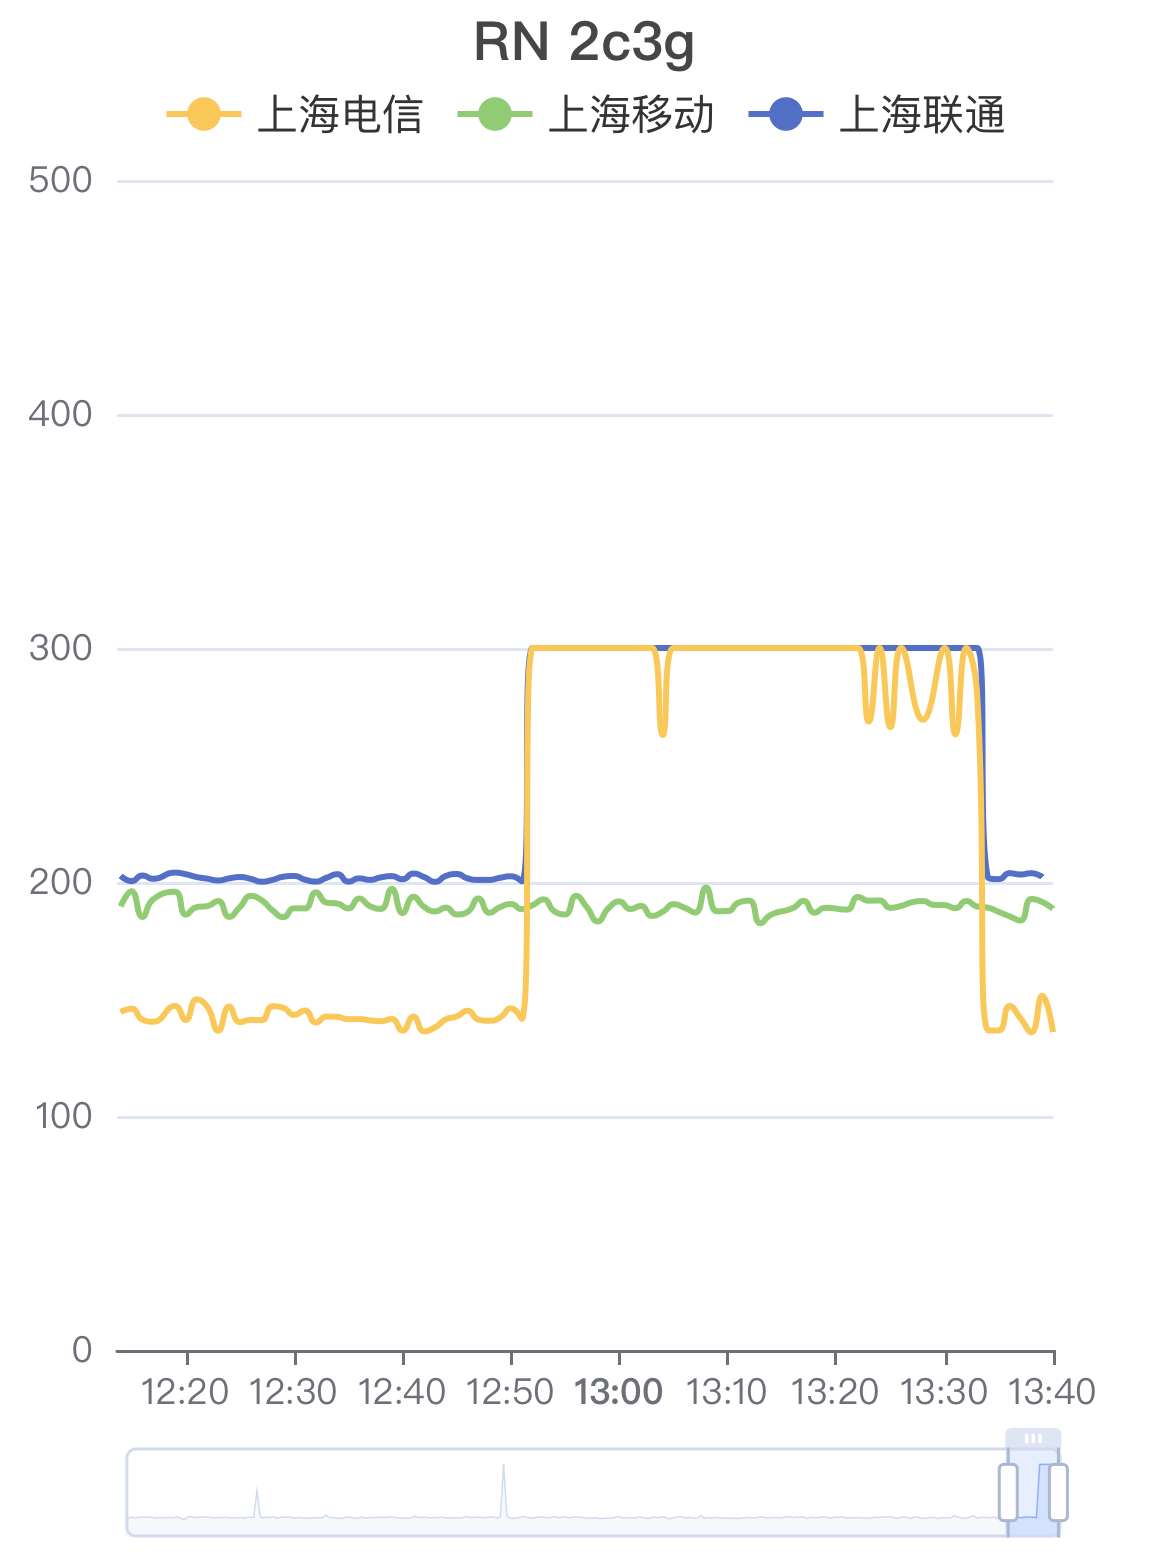
这是前两天中午cc,rn国内访问断了的TCPPing图
TODO
- 增加按天,周,月的纬度
- 后端采集了数据还有很多的优化空间,比如取样间隔等等
使用
- 使用上可能需要自己编译下二进制
- 替换二进制
mv /opt/nezha/dashboard/app /opt/nezha/dashboard/app.old && cp /root/app /opt/nezha/dashboard/app && systemctl restart nezha-dashboard.service
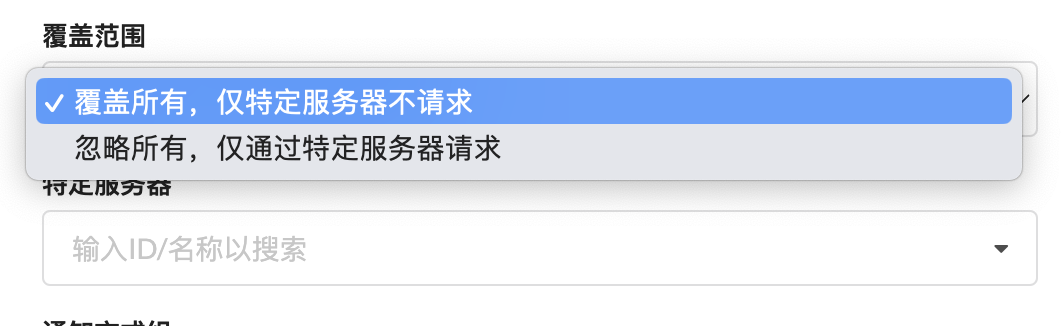
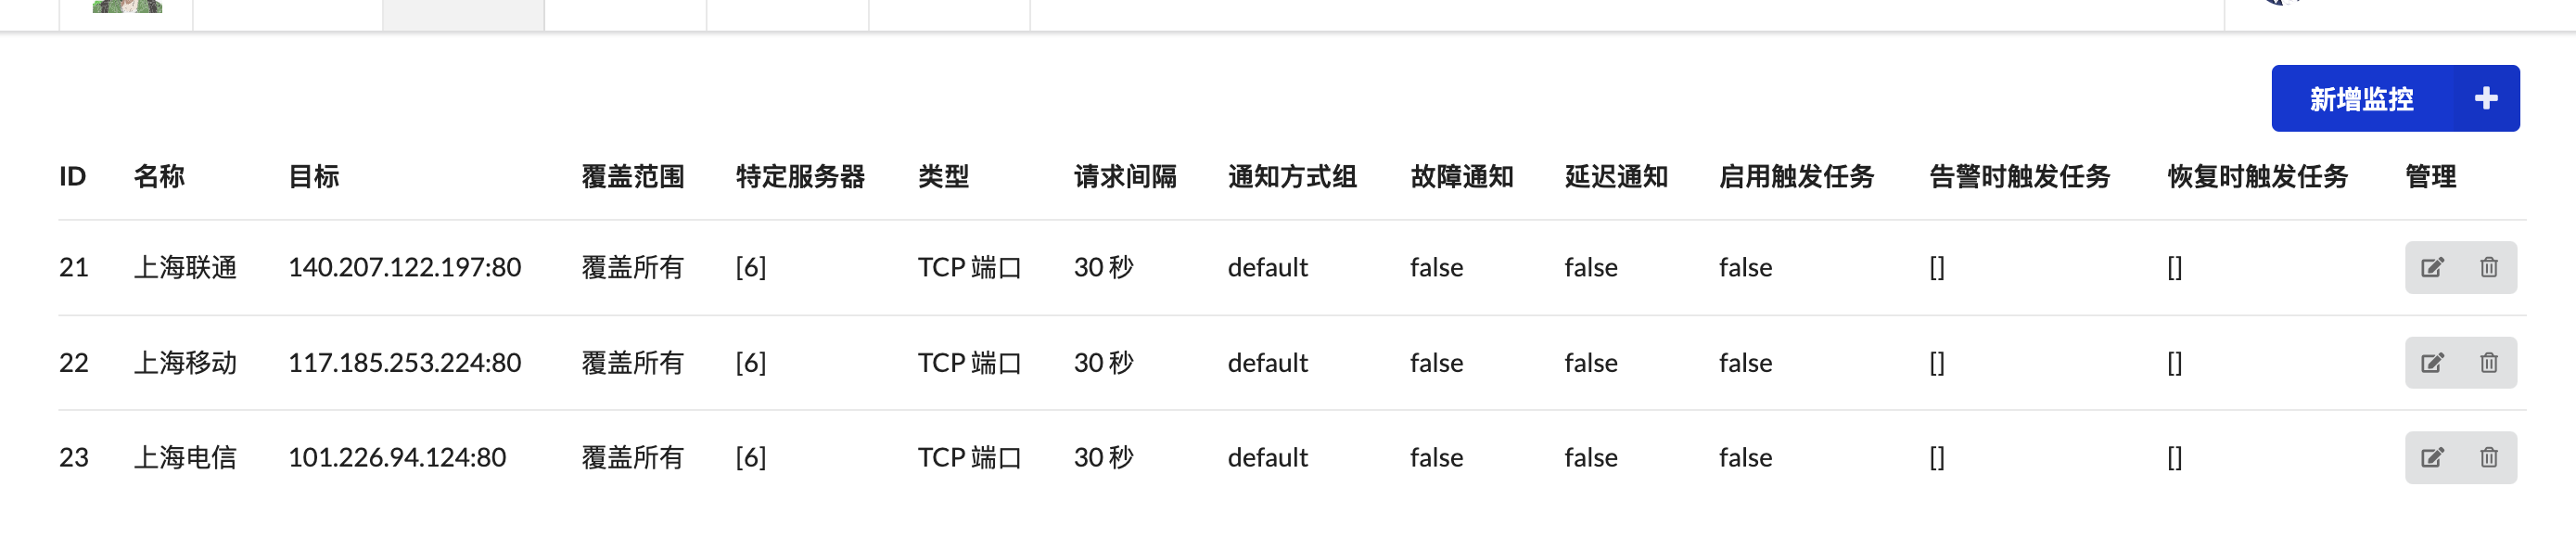
- 配置,举例:我离上海近,出口基本在上海,所以我希望看到我的vps到上海的tcpping,但是我又有国内的机器,这个是不需要ping的,具体配置如下:
- (代码写的很简陋,尤其是前端)但是!

- diy哪吒地址:https://github.com/lvgj-stack/nezha
- diy面板地址:https://github.com/lvgj-stack/nezha-agent-agent
- 感谢FCB大佬发的帖子里面提供的地址https://www.nodeseek.com/post-56400-1
- 感谢哪吒面板,真的不错!